Part of “Five Experiments to Understand Google Adx Better”
When it comes to Google AdX pricing, we all know that pricing rules are one of the most effective tools that the publishers have with optimizing their yield and we have been discussing various strategies to arrive at the right floor price so that publishers can maximise their results.
One aspect important for this experiment is Bid Metrics provided by AdX where we have data about the number of bids received for every ad request, Average Bid CPM, Winning Bid CPM, Close CPM etc. So, we need to first understand what Bid Metrics are and what they mean for publishers.
As we all know, Google AdX calls buying and selling of inventory as Open Auction and the floor prices that publishers set as Open Auction Pricing Rules. When there is an auction running, there has to be buyers and their respective bids. Let us understand what these Bid Metrics are before we can utilize them to set meaningful floor prices.
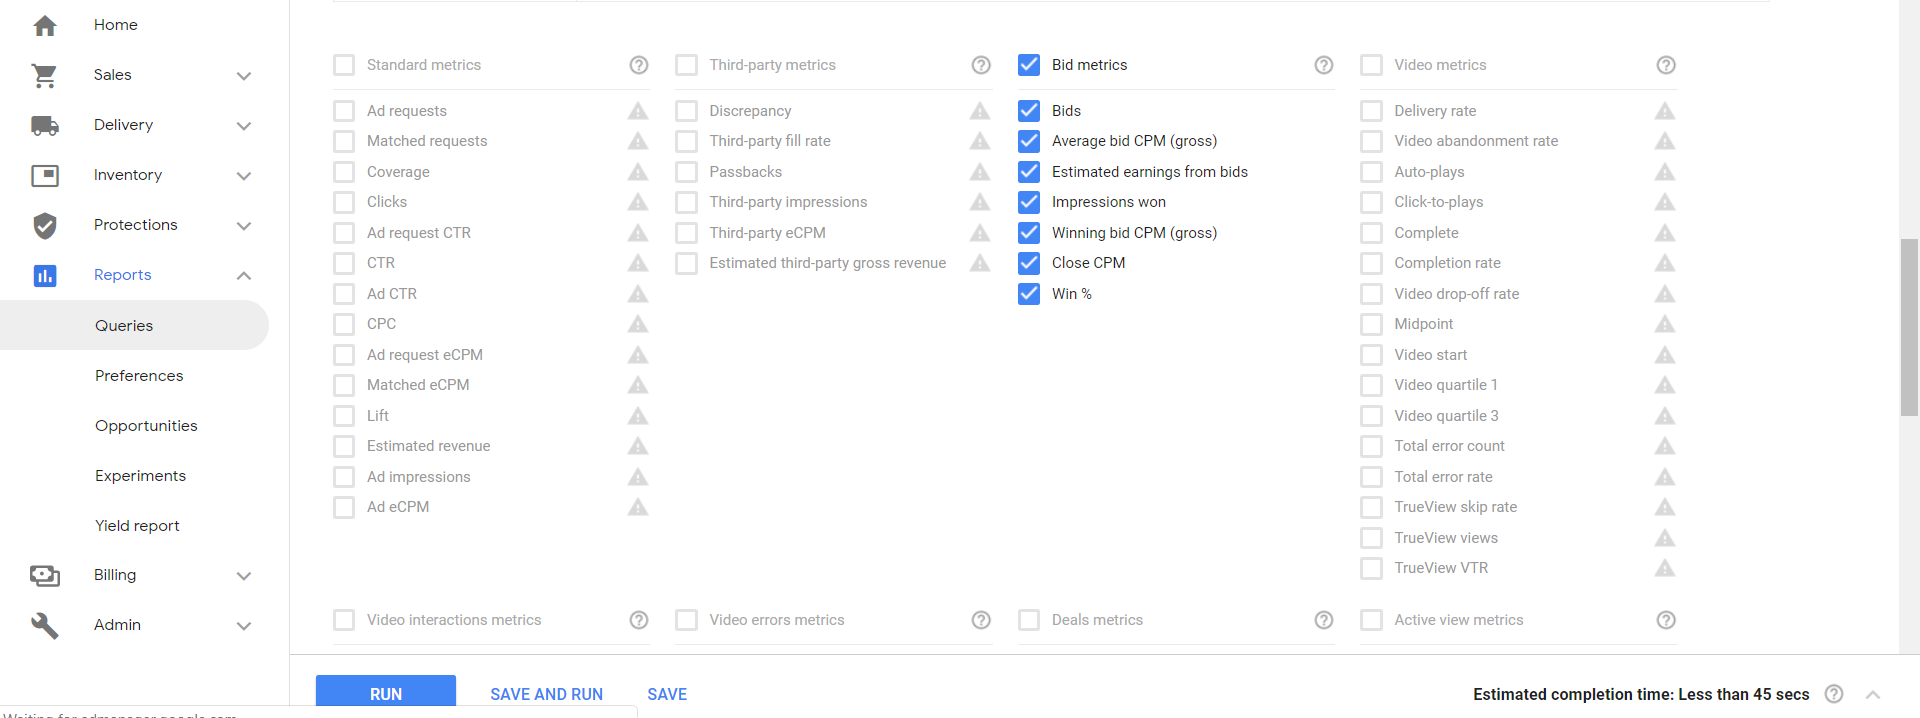
Here is the list Bid Metrics available in Google AdX:
- Bids: Total number of bids received for a single Ad Request. This will include winning bid as well as losing bids.
- Average Bid CPM (gross): Average CPM value of both won and lost bids. This is a simple average. That is sum of all CPM values for every bid divided by total number of CPM values.
- Estimated Earnings from Bids: This is the estimated revenue obtained from winning bids.
- Impressions Won: Number of bids which won and resulted in an impression.
- Winning Bid CPM (gross): This is the average CPM of all the winning bids.
- Close CPM: Close CPM is the CPM that Publishers earn. Since AdX runs a second price auction model, Close CPM will be either the floor set by publisher or 1 cent more than the second highest bid.
- Win %: Win percentage is the number of winning bids divided by total number of bids. We can derive many insights from win percentage such as if win percentage is low, then there are a lot of buyers or bids that have been placed on that piece of inventory (or that specific piece of inventory maybe be having a good demand etc.)
But there is a catch here, as bid data may not be shown to all buyers due to opt-outs. From our past experiences, we have observed it is available from anywhere between 30% & 70% of the buys depending on the geo and that should be quite representative.
Also, Google AdX supports only specific dimensions when these bid metrics are selected and the data is available only for past six months. Some useful dimensions to use along with these metrics are – ‘Bid Ranges’, where it shows how bids received are distributed in buckets of 10 cents. Also this report is generally delayed: Bid data is updated after approximately 36 to 48 hrs. Now to arrive at right floors, we need a combination of dimensions and metrics for our analysis such as bid ranges + advertisers or bid ranges + pricing rules in our dimensions along with the available Bid Metrics.
Now coming to the point of which dimensions to select along with these Bid Metrics: Dimension ‘Bid Ranges(gross)’ and ‘Advertisers’ combination is helpful in knowing how advertisers are bidding and in which range a publisher has received maximum bids from different advertisers. An example is shown in below image as to how the bids vary across each buckets.
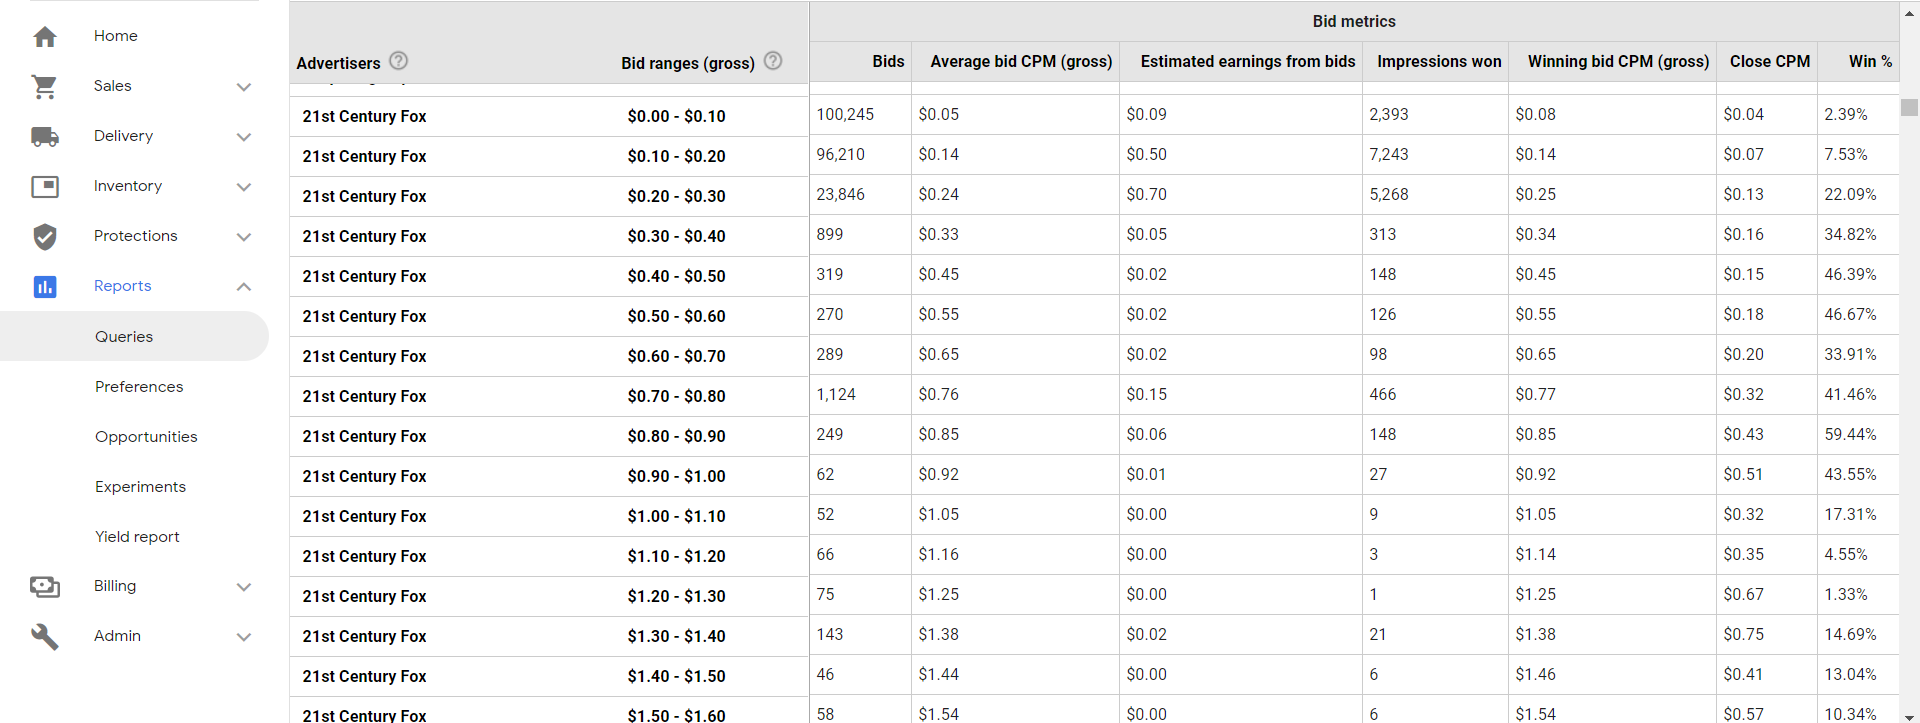
Here, as we can see, maximum bids placed by the advertiser ‘21st Century Fox’ were in the range of $0.00 to $0.10 and win% is 2.39% which means ~97% of the time bids were either won by other advertisers or getting rejected because of floor price. But if you see bid range in the bucket $0.20 to $0.30, Win % is 22% which means 22% of the time the bid has been won by 21st Century Fox. We need to observe here that although the winning bid CPM is $0.25, that’s not what Publishers earn. Publishers earn the price at which the auction is closed (Close CPM) which is $0.13. About $0.12 is lost due to the nature of the second price auction. If we can manage to put a floor between winning bid CPM and Close CPM for this particular advertiser, Publishers can gain the difference in CPM as an upside. Finally, if an advertiser is bidding at very high CPM and if their Win% is also very high, perhaps putting higher floors for that advertiser can yield more revenue.
One more useful dimension combination is ‘Bid Ranges (gross)’ and ‘Pricing Rules’. If you already have your pricing rules in place, you can see how many bids are getting rejected because of your floors. For example, if you put a floor of $0.30, AdX will reject all the bids below $0.30.
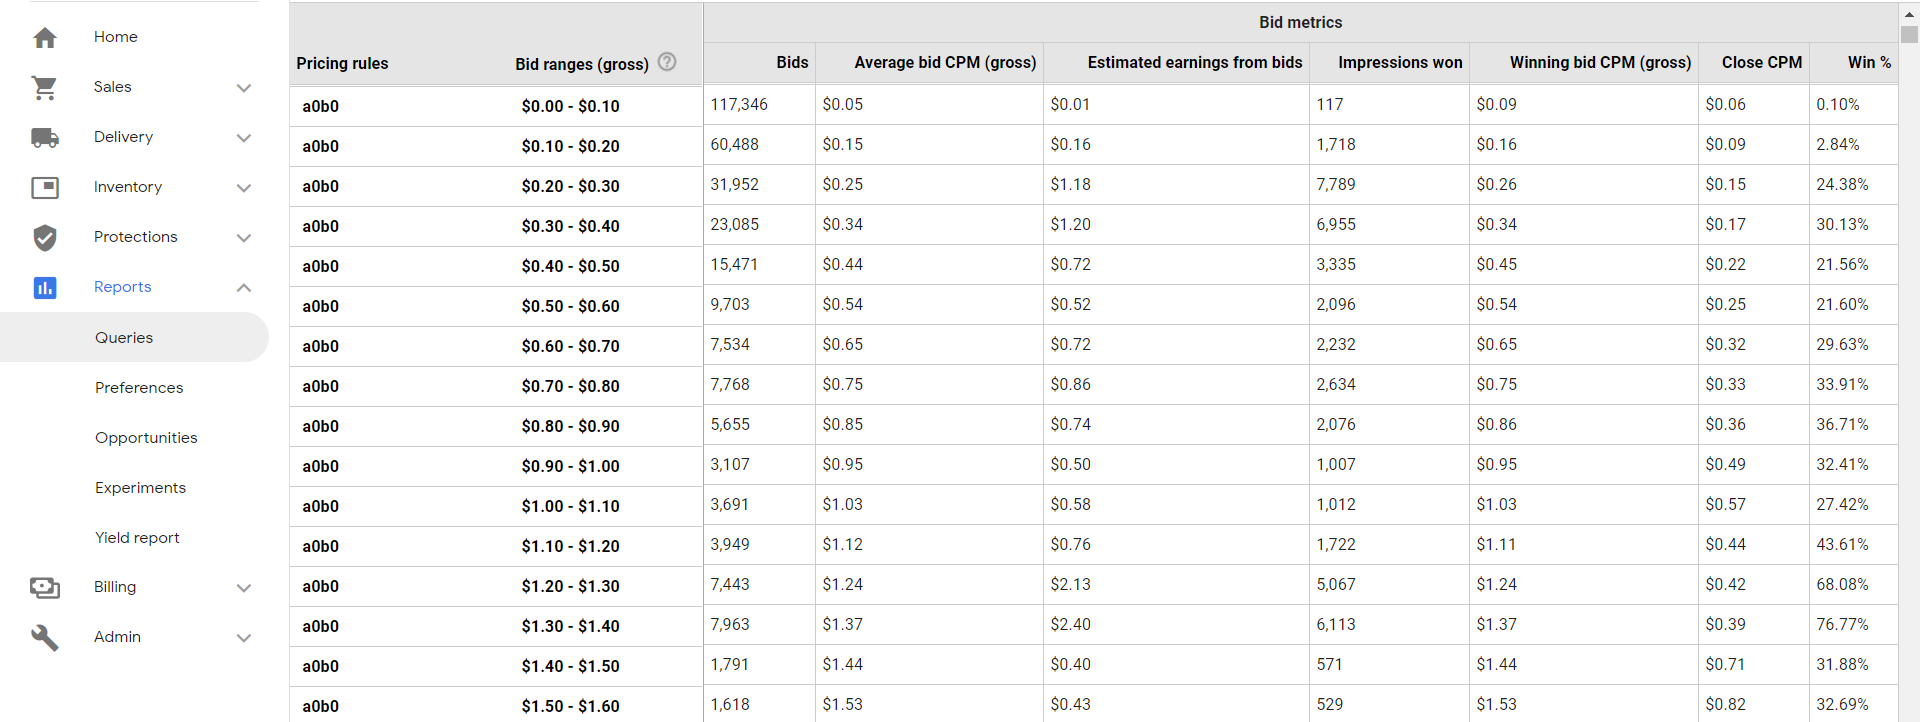
As you can see in the above picture, we ran an experiment to know the bid distribution of our inventory and set a zero floor for both Anonymous and branded. Again, $0.00 – $0.10 bucket received highest number of bids however, here we see that bucket $1.30 – $1.40 is yielding the highest revenue. Also, if you observe, the winning bid CPM in most of the cases is above $0.50 whereas close CPM in most of the cases is less than $0.50. So, we need to figure out if we can get more yields by scientifically placing our floor price somewhere around $0.50 so that our floor is similar to the Close CPM. With mathematical modeling techniques, we can figure out to some extent, using the above bid rage data, what floor should we be setting in the above scenario so that we can maximize yields. This is exactly what we do with Tercept’s Ad Revenue Optimization offering. And from our past experiences, we believe we can get anywhere between 30% to 100% upside with robust modeling & real time auction-level pricing.
Our next post in this series coming out next week is “Does stopping open-auction give better results overall & if so, why?” If you found this post useful, please don’t hesitate to subscribe to our blog!
Author
Vinay B Rao
Senior Business Analyst, Tercept

0 Comments Leave a comment